For groups of hotels, stores, clinics or companies
Every site on one page. Compared fairly.
You can't manage what you can't see. When each site reports its own way, the group view takes days and nobody trusts the ranking. We bring all of every site's data, from finance and operations to sales and marketing, into one set of numbers, with the same rules, fair comparisons and a group total that adds up.
 You'll work with Zohal Zahir, Microsoft certified in Power BI and Fabric.
Sound familiar?
If you tick two or more, this page is for you.
- Each site sends a different spreadsheet
- Group financials take days to put together
- A small site and a big site can't be compared fairly
- A lender or investor asks, and it takes a week
- Managers can see every other site's numbers
- The same customer appears in every branch under a different name
The hidden problem
Every branch you acquired writes names differently
Each branch kept its own system and its own habits. So one customer can appear three times, and nobody can tell if they are the same person. Totals double-count and the group view is wrong.
This is a hard problem. We solve it with advanced data science techniques, known as entity resolution, so you get centralised visibility of every customer across every branch.
How we find out if they are the same person
- CleanTidy names, addresses and phone numbers into one format: "St" and "Street", spaces and capitals.
- CompareCheck name, address, phone, email and date of birth together, allowing for nicknames and typos.
- ScoreGive each pair a match score. Strong matches are linked automatically.
- ConfirmUnsure matches go to a person to check. Nothing is guessed.
The same method works for suppliers, products and the branches themselves, and it keeps working as new records arrive.
Case study
A hotel group: from dozens of workbooks to one platform
Property workbooks that could not feed Power BI. Benchmarking, debt schedules and budgets spread across dozens of sheets. A week of work whenever a lender or investor asked a question.
Each property's files land automatically and are standardised. Size-adjusted benchmarking, profit by property and revenue line. Owner, investor and lender reporting on demand, proved back to the ledger, with each person seeing only what they should.
"Zohal did an excellent job on our Power BI project. She was professional, responsive, and demonstrated a strong understanding of Power BI, data visualization, and reporting requirements. … The final dashboards and reports were well-structured, clear, and very useful."Client, hotel portfolio group · ★★★★★ verified review
What you get
One report for the whole group, and the right view for every person in it.
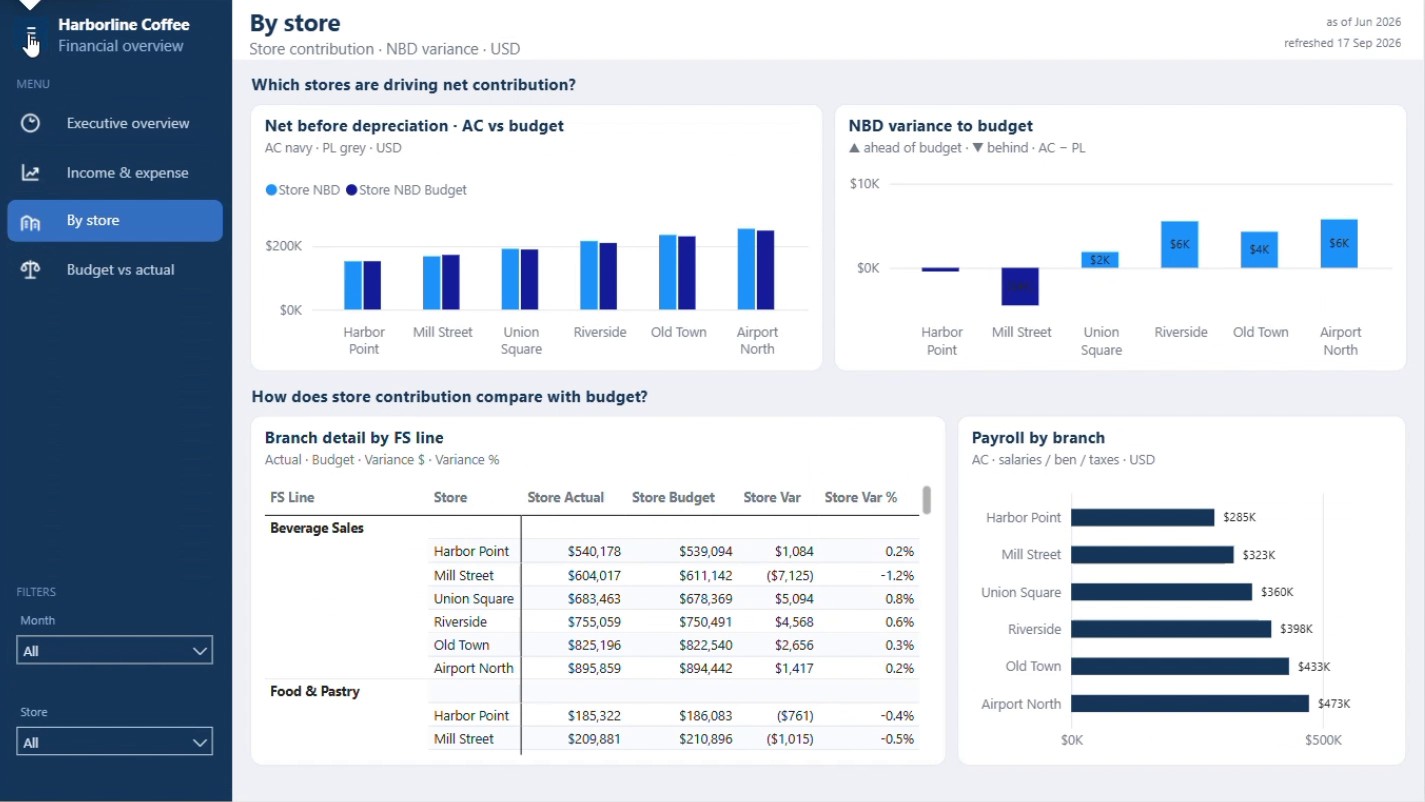 Example multi-store report, sample data
You can't manage what you can't see
One central view: the foundation for reporting and AI
Matched, centralised data is what makes every report trustworthy, and it is what AI needs too. AI is only as good as the data under it.
- 4You getPlain-word answers you can trust
Ready for AI
Copilot on your Power BI reports answers from the same checked numbers.
- 3You getLeague table, group financials, benchmarks, KPIs
Reports for every audience
Managers, owners, lenders: each sees the right view of the same numbers.
- 2You getOne source of truth, checked daily
One central model
Same accounts, same rules, governed and monitored on every refresh.
- 1You getNo double counts, no missing sites
Matched master lists
Every site, supplier, customer and product recognised across every system.
How it is priced
From AUD 90 an hour. You see the estimate first.
Before any work starts, you get a written estimate of the hours for each stage. Bigger groups are built in phases, so you see the first sites working early and sign off each step. If something needs more time, we tell you and you approve it first.
What changes the hours
- How many sites and companies you have
- How messy the names and codes are across systems
- How different each site's data is
- How you want to compare them: per room, per square metre, per staff hour
- How many audiences need their own view: managers, owners, lenders
- Whether you need Microsoft Fabric underneath, or Power BI alone
A good first step is often two or three sites, then the rest once the rules are agreed.
How it works
Free call
How your sites report today.
Agree the rules
One chart of accounts, one way to compare.
First sites live
Two or three sites, checked against the ledger.
Whole group
All sites, security set, team trained.
Questions group owners ask
Our sites use different systems and spreadsheets. Can you still combine them?
Yes. Each site's files or system exports are mapped to the same accounts and rules as they come in, so the group view is built automatically, however each site sends its numbers.
How do you compare sites of different sizes fairly?
By comparing per unit as well as in total: per room, per square metre, per staff hour or per customer, whichever fits your business. A small site doing well is no longer hidden behind a big site's totals.
How do you know if two customers from different branches are the same person?
This is a hard problem, solved with advanced data science techniques known as entity resolution. We compare names, addresses, phones and emails, allowing for typos and nicknames, link strong matches automatically and send unsure ones to a person to confirm. The result is centralised visibility of every customer across every branch.
Can each manager see only their own site?
Yes. Row-level security means each manager sees their site, area managers see their area, and owners see the group, all from the same report. It is set up and tested before go-live.
Will the group total match our accounts?
Yes. The group total equals the sum of the sites, and it is reconciled to your ledger before handover.
Can we add new sites later?
Yes. A new site is added by mapping its data once. The reports, comparisons and security pick it up automatically.
How much does it cost?
From AUD 90 an hour. Before any work starts you get a written estimate of the hours for each stage. The hours depend on how many sites and entities you have, how different their data is, and how many audiences need their own view.
Do we need Microsoft Fabric?
Not always. A few sites with clean data can run on Power BI alone. Many sites, many files, or lender and investor reporting usually need Fabric underneath. We tell you which on the free call.
See every site clearly, every month.
A free 30-minute call. Tell us how many sites you have and how they report today. You get an honest view of what it takes.